Worst-case Scenario?
Are charted depths based on the worst-case scenario?
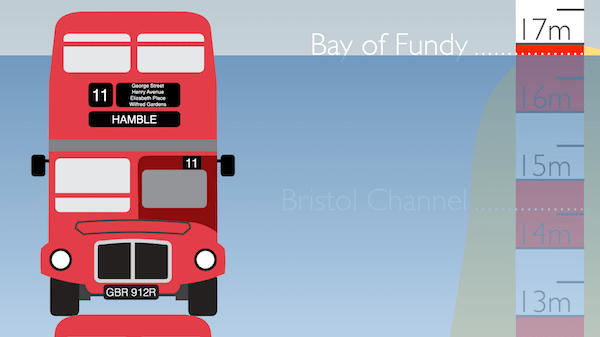
Traditional and electronic navigation charts (ENCs) provide us with an understanding of depth, particularly near the coastline. Generally, we ask ourselves: Can we float? After all, we don’t want to run aground!
The numbers provided on charts give a likely worst-case scenario, known as chart datum. For many, this is enough to make sensible decisions on safe navigation, but a deeper knowledge (excuse the pun) can open up a whole world of opportunity.
So what is Chart Datum?
In maritime terms, chart datum is the level to which depths and tidal heights are referred. It is typically chosen as the lowest tide level predicted during average meteorological conditions.
Chart Datum is Lowest Astronomical Tide, right?
Not quite. While it often aligns itself to the Lowest Astronomical Tide (LAT), chart datum is calculated using a slightly more sophisticated model than just the astronomical understanding of tidal rise and fall. The actual astrological impact (the sun and moon’s positions) and the ‘bulges of water’ we often hear about are just the starting point for the tides. The topology of the landscape has a more significant impact on what we’ll experience anywhere on Earth. Charts and chart datum are calculated using local knowledge of how the tides will play out in a given location.
The Benchmark for Tidal Measurements
Newlyn, a small town in Cornwall, holds significant importance in tidal science. Since 1915, it has been the site of the UK’s primary tidal observatory. The Newlyn Tidal Observatory was established to provide accurate measurements of sea levels, which are crucial for nautical charting and coastal management. Data collected from Newlyn has been instrumental in defining the mean sea level for the UK, monitoring long-term sea-level changes, and being the benchmark for calculating chart datum.
Things can only get better (or can they?)
Meterorlogical Impact
Air pressure and wind can also impact the amount of water in a given location, and chart datum is usually provided using average localised meteorological conditions. So, while we consider chart datum the worst-case scenario, this is potentially untrue. Given the right conditions, it could be worse (shallower) than our charts suggest.
Air Pressure
High pressure (falling air) is heavier than low pressure (rising air), and the weight of the air on the sea’s surface can impact how deep it is, essentially squashing the water. This can alter the astrological averages given to us on the chart.
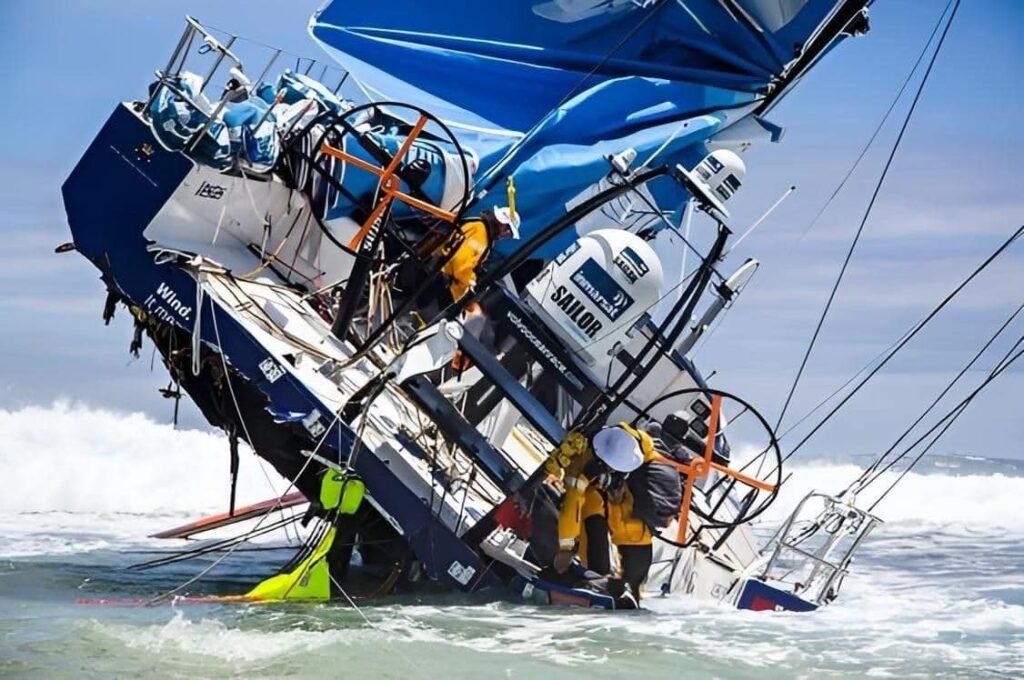
WIND STRENGTH
The current sea state should also be considered when interpreting and understanding the information provided by our charts. The strength of wind has a direct correlation to wave height and, therefore, the depth of water.
Meteorological Correction Tables
As with many navigation tools, localised information augments the data provided by charts and Almanacs. The port of Southampton has a Meteorological Correct Table, which enables us to understand what impact the current conditions will have on our charted data.
Table A – Barometric Table
| mb | Correction |
|---|---|
| 965 | +0.6m |
| 975 | +0.5m |
| 985 | +0.4m |
| 995 | +0.3m |
| 1005 | +0.2m |
| 1015 | +0.1m |
| 1025 | -0.1m |
| 1035 | -0.2m |
| 1045 | -0.3m |
Table B – Wind Table
| Direction | Force 5 | Force 10 – 12 |
|---|---|---|
| N | -0.2m | -0.5m |
| N.E | -0.2m | -0.5m |
| E | -0.1m | -0.3m |
| S.E | -0.1m | -0.2m |
| S | -0.0m | -0.0m |
| S.W | -0.0m | -0.0m |
| W | -0.0m | -0.0m |
| N.W | -0.1m | -0.3m |
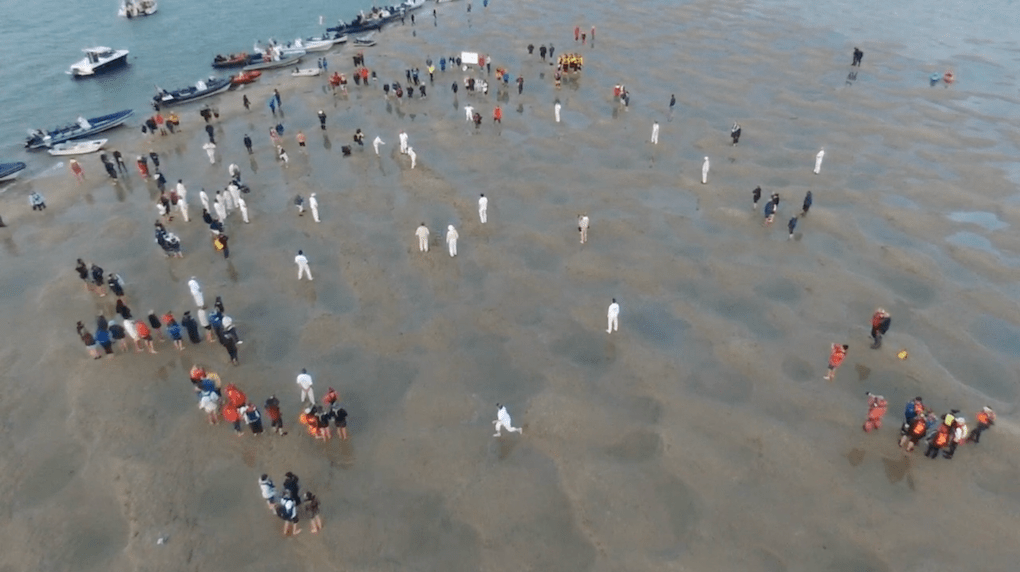
New Opportunities
This knowledge allows us to interpret our charts and chart plotters with better accuracy. Combining this with an ability to understand the tidal state allows us to go to more places, plan safer routes and even attend unique events!